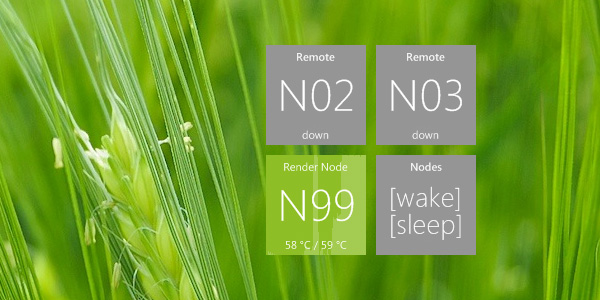
Rainmeter render node skin: Dual CPU
The Rainmeter render node skin works flawlessly for me for almost a year. With its help I can easily monitor the temperature of a node and load histogram, and it gives the access to Remote Desktop with a single click. And it’s freaking simple! I have only Single-CPU nodes, well, that’s fine for me, nothing fancy like dual or quad CPUs based server platforms.
Here’s a version of the skin for the dual cpu nodes.

The same
It looks the same, it does the same, it is the same. And nothing special happened in the code. Maybe only this part that parses new data from Open Hardware Monitor:
[JSON]
Measure=Plugin
Plugin=WebParser
URL=#json#
RegExp={(.*)}
ForceReload=1
Substitute="":"-1"
UpdateRate=5

[OHM0]
Measure=Plugin
Plugin=WebParser
URL=[JSON]
RegExp=(?siU).*#CPU# 0.*Temperatures.*CPU Core ##Core#.*Value": "(.*)°F.*CPU Total Load.*Max": "(.*)".*

[OHM1]
Measure=Plugin
Plugin=WebParser
URL=[JSON]
RegExp=(?siU).*#CPU# 1.*Temperatures.*CPU Core ##Core#.*Value": "(.*)°F.*CPU Total Load.*Max": "(.*)".*
It takes the data from node’s JSON only once per update (2000 ms by default), to avoid double requests. Then it splits this data for each processor (say, OHM0 for Intel Xeon E5-2670 0 and OHM1 for Intel Xeon E5-2670 1), using new and simplified regular expression which generates only 2 indices for the temperature and for the load. It means two different degrees, one for each processor, in Celsius or in Fahrenheit, depending on the OHM’s settings of the node. See also variables.inc inside the installed skin folder to change the scale letter. And the histogram shows the combined usage of both CPUs, simple sum CPU1+CPU2 divided by 2.
That’s all for today. I hope this Rainmeter skin is useful.
Have a good day.